This nice video on Zipf’s law got me thinking about the seemingly ubiquitous observation of Zipf-like distributions in empirical data.
The basic idea is that:
- If you rank items (words, cities, names, etc.) by how frequently they occur, their frequency is inversely proportional to their rank.
We see instances of Zipf’s Law all the time in our research on human mobility: in the distribution of cities by population size, or the frequency of travel between cities.
If we can observe this pattern in inter-city movements, what about a very personal source of data: my Logseq graph?
I have built my graph of notes across multiple years. The basic principle I use is to link notes to projects or people.
These links can be recovered in topic-specific pages where I can find every note related to a given topic.
So, if I count all of the links in my graph, do we find another instance of Zipf’s Law?
Here is a log-log plot of the number of times a page is mentioned (y-axis) vs. the frequency rank of each page (x-axis):
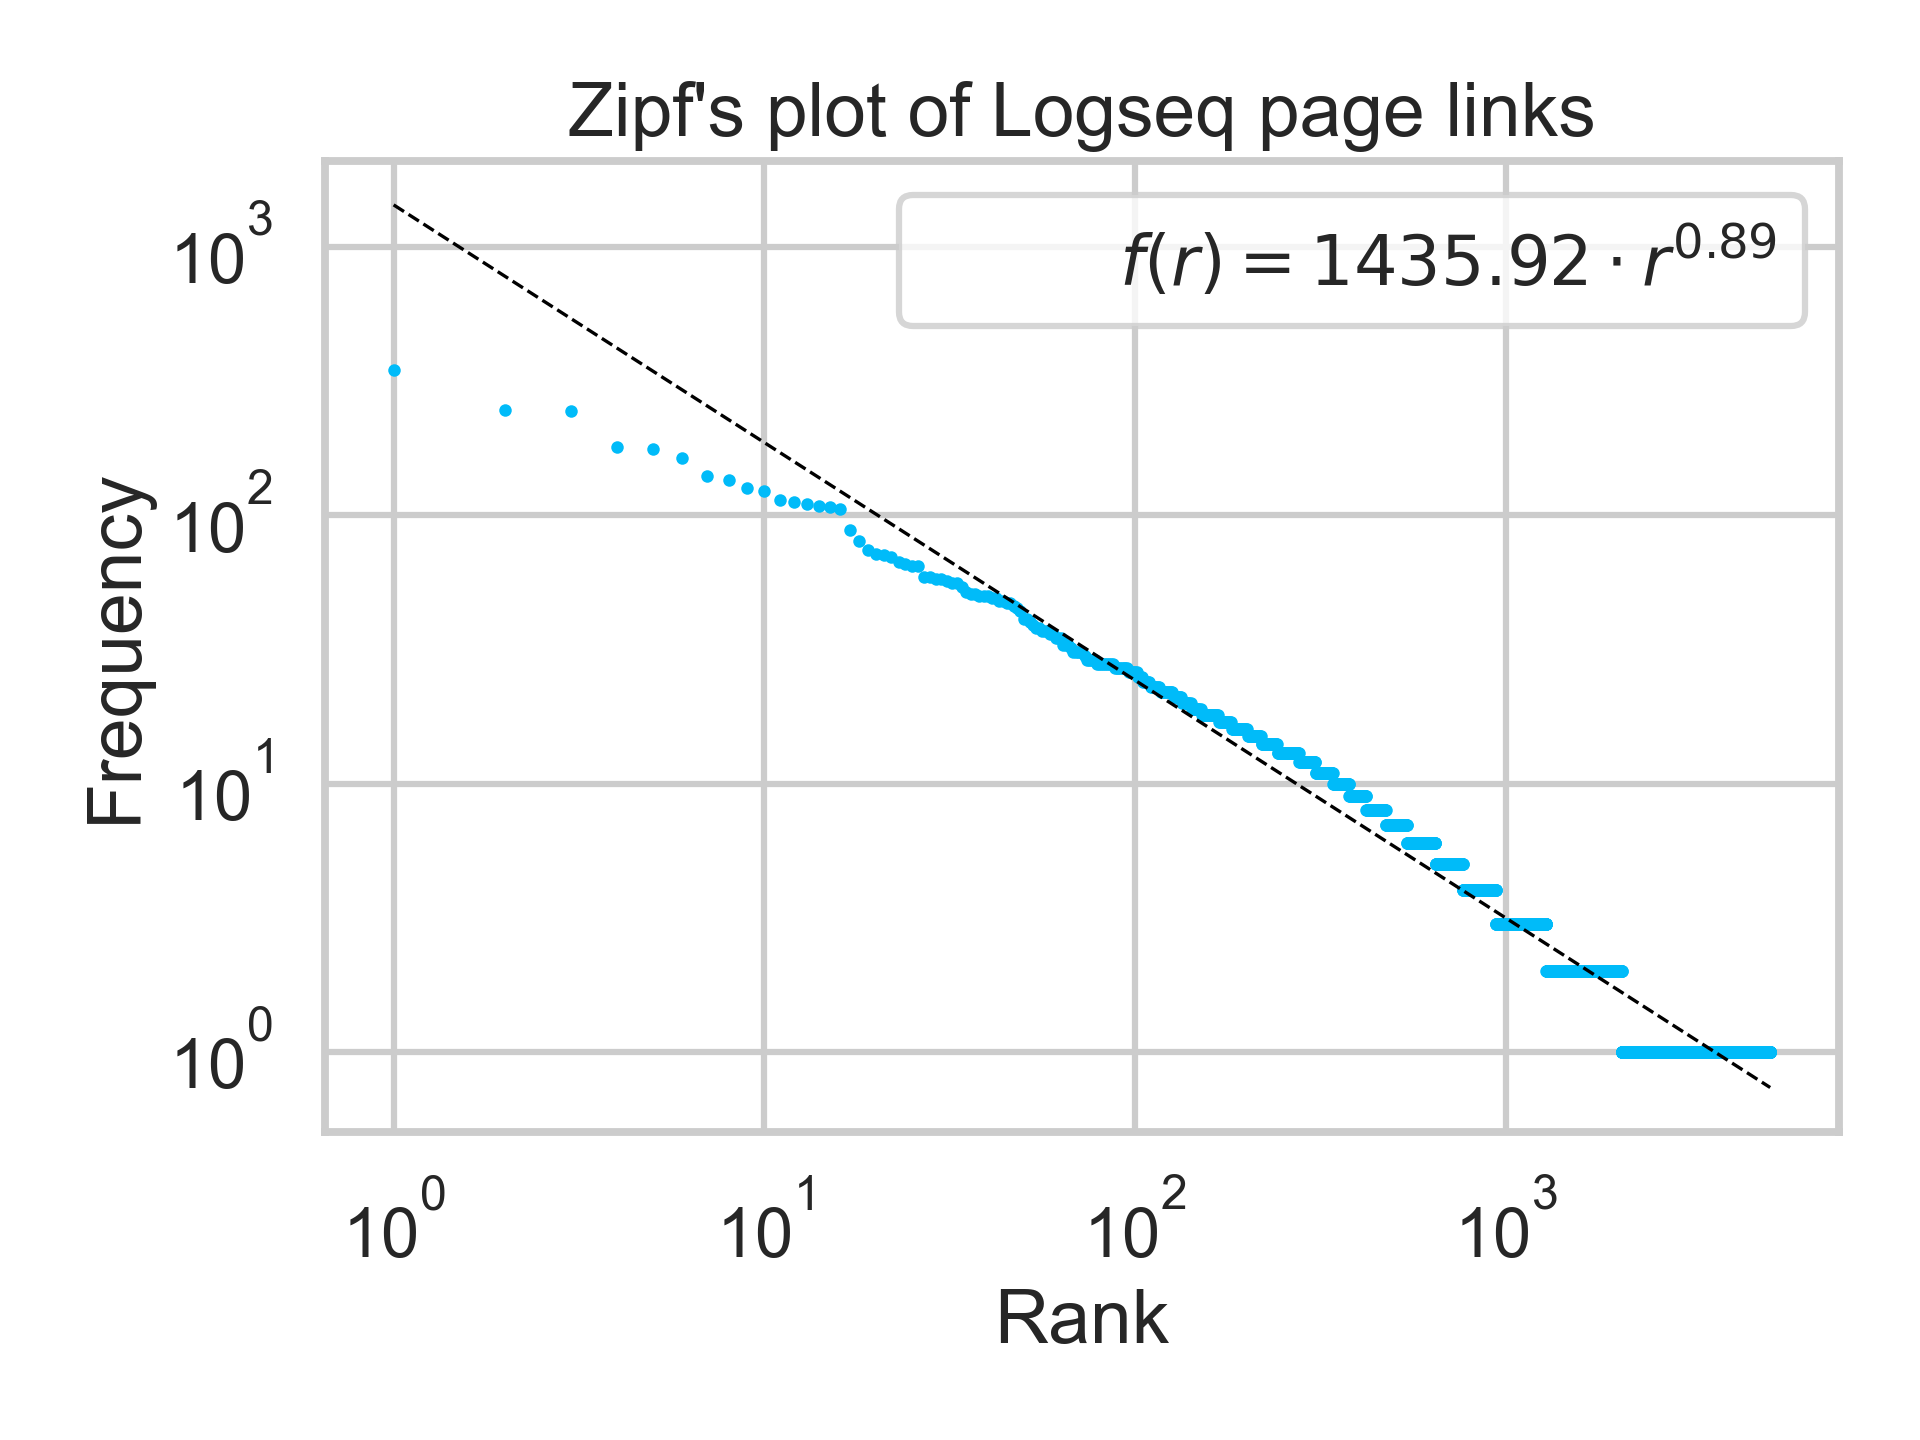
Sort of, with interesting caveats!
Overall, Zipf’s Law describes my lower-frequency data well, and the power-law model has $R^2 = 0.948$. But at the top-end of the distribution, my highest-linked pages occur at much lower frequencies than predicted. This means that I have a more even distribution of topic-mentions than a pure Zipf distribution would suggest. I have two guesses why:
Term specificity: I intentionally structure the topics in my graph to avoid being overly general. A page like “Research” simply isn’t useful because nearly everything would link to it. So, the lack of unconstrained growth in links probably arises from heuristics I have developed, trying to find the appropriate name for a project or topic at the correct granularity. logseq.order-list-type:: number
Less preferential attachment: rather than benefitting from the effect of preferential attachment (early nodes receive initial links and these links making the nodes more popular over time), the topics in my graph reflect my changing focus over time. This might remove the “first entrant” advantage of earlier nodes. logseq.order-list-type:: number
And what are the top-ranked pages? My PhD and Postdoc supervisors, of course: James Cheshire, Roz Eggo, and Esteban Moro. Pretty neat!
Full code I used to parse my logseq graph are available in this repository.