Authors: Hamish Gibbs, Naomi R. Waterlow, James Cheshire, Leon Danon, Yang Liu, Chris Grundy, Adam J. Kucharski, LSHTM CMMID COVID-19 Working Group, Rosalind M. Eggo
Published: October, 2022 in Wellcome Open Research
Abstract
Background: Mobility data have demonstrated major changes in human movement patterns in response to COVID-19 and associated interventions in many countries. This involves sub-national redistribution, short-term relocations, and international migration. Aggregated mobile phone location data combined with small-area census population data allow changes in the population distribution of the UK to be quantified with high spatial and temporal granularity.
Methods: In this paper, we combine detailed data from Facebook, measuring the location of approximately 6 million daily active Facebook users in 5km 2 tiles in the UK with census-derived population estimates to measure population mobility and redistribution. We provide time-varying population estimates and assess spatial population changes with respect to population density and four key reference dates in 2020 (first UK lockdown, end of term, beginning of term, Christmas).
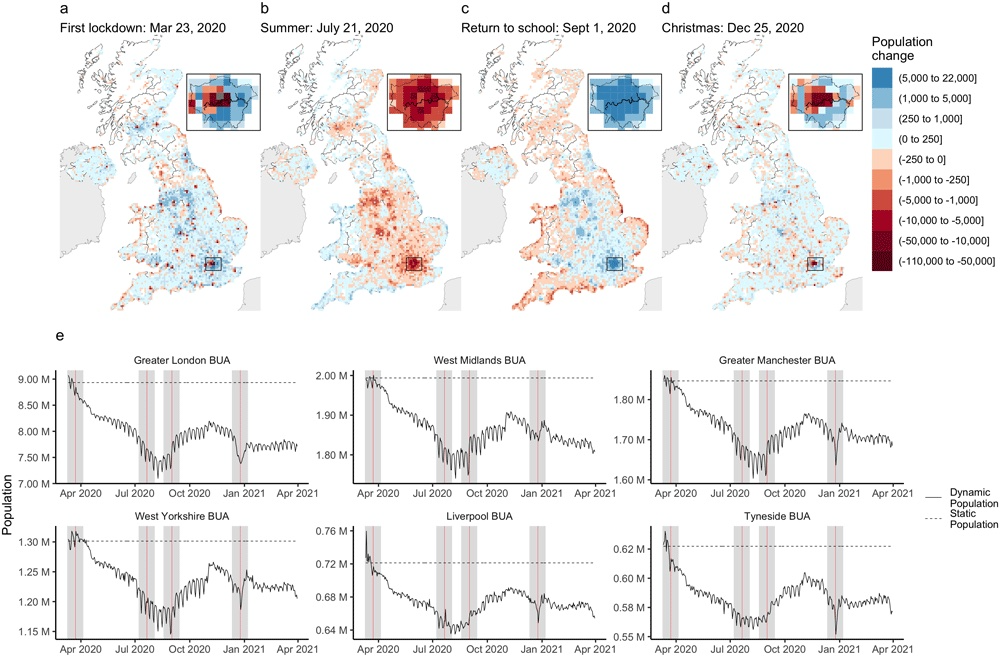
Results: We show how population estimates derived from Facebook data vary compared to mid-2020 small area population estimates by UK national statistics agencies. We also estimate that between March 2020 and March 2021, the total population of the UK declined and we identify important spatial variations in this population change, showing that low-density areas have experienced lower population decreases than urban areas. We estimate that, for the top 10% highest population tiles, the population has decreased by 6.6%. Finally, we provide evidence that geographic redistributions of population within the UK coincide with dates of non-pharmaceutical interventions including lockdowns and movement restrictions, as well as seasonal patterns of migration around holiday dates.
Conclusions: The methods used in this study reveal significant changes in population distribution at high spatial and temporal resolutions that have not previously been quantified by available demographic surveys in the UK. We found early indicators of potential longer-term changes in the population distribution of the UK although it is not clear if these changes will persist after the COVID-19 pandemic.
Cite
@article{gibbs_population_2022,
	title = {Population disruption: observational study of changes in the population distribution of the {UK} during the {COVID}-19 pandemic},
	volume = {7},
	issn = {2398-502X},
	url = {https://wellcomeopenresearch.org/articles/7-243/v1},
	doi = {10.12688/wellcomeopenres.18358.1},
	shorttitle = {Population disruption},
	abstract = {Background: Mobility data have demonstrated major changes in human movement patterns in response to {COVID}-19 and associated interventions in many countries. This involves sub-national redistribution, short-term relocations, and international migration. Aggregated mobile phone location data combined with small-area census population data allow changes in the population distribution of the {UK} to be quantified with high spatial and temporal granularity. Methods: In this paper, we combine detailed data from Facebook, measuring the location of approximately 6 million daily active Facebook users in 5km2 tiles in the {UK} with census-derived population estimates to measure population mobility and redistribution. We provide time-varying population estimates and assess spatial population changes with respect to population density and four key reference dates in 2020 (first {UK} lockdown, end of term, beginning of term, Christmas). Results: We show how population estimates derived from Facebook data vary compared to mid-2020 small area population estimates by {UK} national statistics agencies. We also estimate that between March 2020 and March 2021, the total population of the {UK} declined and we identify important spatial variations in this population change, showing that low-density areas have experienced lower population decreases than urban areas. We estimate that, for the top 10\% highest population tiles, the population has decreased by 6.6\%. Finally, we provide evidence that geographic redistributions of population within the {UK} coincide with dates of non-pharmaceutical interventions including lockdowns and movement restrictions, as well as seasonal patterns of migration around holiday dates. Conclusions: The methods used in this study reveal significant changes in population distribution at high spatial and temporal resolutions that have not previously been quantified by available demographic surveys in the {UK}. We found early indicators of potential longer-term changes in the population distribution of the {UK} although it is not clear if these changes will persist after the {COVID}-19 pandemic.},
	pages = {243},
	journaltitle = {Wellcome Open Research},
	shortjournal = {Wellcome Open Res},
	author = {Gibbs, Hamish and Waterlow, Naomi R. and Cheshire, James and Danon, Leon and Liu, Yang and Grundy, Chris and Kucharski, Adam J. and {LSHTM CMMID COVID-19 Working Group} and Eggo, Rosalind M.},
	urldate = {2023-02-13},
	date = {2022-10-03},
	langid = {english},
	file = {Gibbs et al. - 2022 - Population disruption observational study of chan.pdf:/Users/hamishgibbs/Zotero/storage/9WWIHNRT/Gibbs et al. - 2022 - Population disruption observational study of chan.pdf:application/pdf},
}